Trade Options Like Professional With Hedging AnalyticsMarket OutlookSystematic Option ChainBest Strikes & ExpiryGlobal CuesKey Market LevelsStrategy & ExpectationsOptions Data Analytics

Access it from any device. Anywhere and Anytime. Dashboard is always at finger tips.

Global cues that change the course of Indian market through out the day.

Mission critical information & analytics such as market outlook (short & long), sentiments of big players, hedging, strikes & expiry selection, etc.

Easy to understand data and analytics snapshopts for NIFTY and BANKNIFTY, with help pop-ups for new users.
EXPLORE THE MIND BOGGLING FEATURES OF OPNODES
ALL IN ONE DASHBOARD FOR OPTIONS TRADERS
Live Market Analytics & Reco
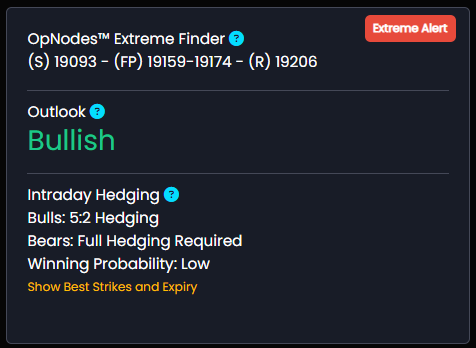
Markets Extreme Finder: Levels that are not easy to cross
Outlook – Bearish / Bullish / Neutral: Expected view for immediate time (current weekly expiry)
Hedging Recommendation for Intraday: Whether your are of bullish view or of bearish view, reco section helps manage positions from slipping out of the hand
Extreme finder is the price projection system that finds sweet spots where the price will halt for pull back or for reversal. Crossing these points is not easy during the day trades and likely serve as adjustment points for options traders. Exception is the case of news or event.
(S) Price: Short side extreme point, also referred to as Support level.
(R) Price: Extreme point on the long side, also referred to as Resistance level.
(FP) Price: Fair price range that acts are fall back price range from extremes. Also acts as breakout and direction identifier. In the Bearish market, price mostly remain below the upper point of the FP range, and vice-versa. Repeated move above and below the FP range are considered as sign of struggle between bulls and bears.
Dynamic nature of Extremes: You would notice that the extremes and fair price range are both dynamic and keep updating during the day. This is because the big players are continuously adding/removing their positions and this impacts extremes and FP range.
Visual Bulb Light: Visual light is an eye catching notification to let the trader know that market is losing steam while moving towards extreme. Market is likely to fall back to fair price or to remain very slow when alert is ON. Thus it is good to lower the risk.
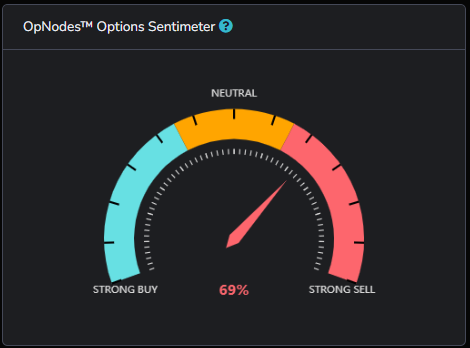
Options Sentimeter One Meter, Deep Information
- Big Player’s Inclination: Calculates the big players activities in Options Chain
Sentiments-As-It-Happens: Strong buying or strong selling or whether the sentiments are neutral (long term outlook)
Quantified measure: Visual check along with quantified score of options chain activites
Options sentimenter displays the expected preferences of big players in terms of creating long and short positions in option chain of the underlying asset.
What is Sentimeter: Sentimeter is the measure of activity of big players in both Puts and Calls for given expiry of option chain and asset.
Strong buy: Big players activity in options is oriented towards long side.
Strong sell: Big players are preferring to create positions in options for short side.
Neutral zone: Activity of big players in options is neutral i.e. neither long nor short. This scenario is considered good by the option writers.
Market Snapshot
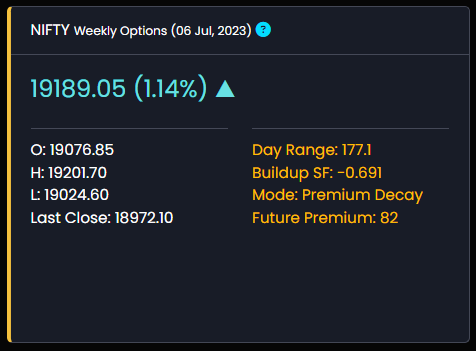
Build-up Strength Factor (SF): Who is dominting the market (writers when SF is negative or buyers when it is positive)
Market Stats: Observe the data that changes the game for options trades including Day Range, Positions Rollover & Future Premium at one place
Options Expiry: Know the type and expiry of options getting used for analysis
Stats widget provides below information
Expiry information: Instrument’s expiry day that is used for for analytics.
OHLC Data: Intrument’s OHLC data of the day
Day Range: H-L range of the day
PCR OI: Put to Call Ratio of Open Interest of Options. PCR OI is calcuated for strikes registering the most activity and using properietary method.
PCR Vol: Put to Call Ratio of Volume of Options. PCR vol is calcuated for strikes registering the most activity and using properietary method.
Future Premium: This is the difference in spot price and future price of the underlying asset. Discounted future price is shown with negative sign.
Monthly Pos Rollover: This is the measure of future’s positions of underlying asset getting rolled over to next month expiry, i.e. current month positions are getting closed and next month positions are getting opened simultaenously.
Options Strategy Reco
- Strategy for Options Traders: Buying or writing, straddle or risk trades, OpNodes does the analysis for you and pick best strategy
- Next Move Prediction: Know what is expected from the market in advance. Not just the guide but OpNodes also warn against risk trading when conditions are not good for options traders
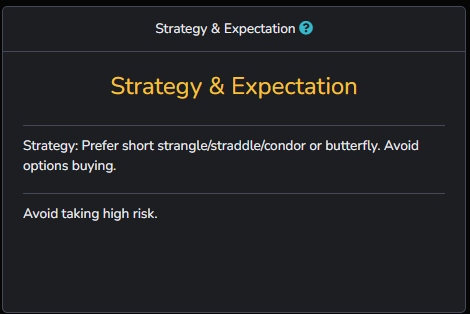
Strategy and expectation sections presents the continuous analysis of Options Chain. It highlights what could be the best strategy for trading in Options as per present scenario.
Strategy: Best strategy recommended based on changes happening in Options Chain. Recommendation is made based on expectation of maximum profitability.
Expectation: Based on current positions build-up, what is expected as forthcoming moves in the Options prices and in price of underlying asset.
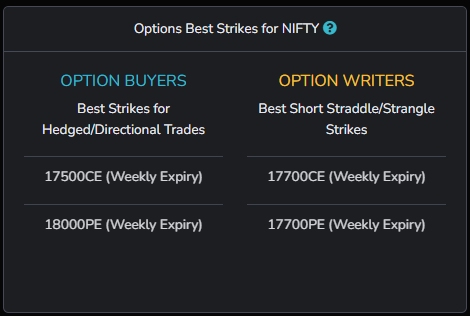
Right Strikes & Expiry of Options
- Hedged Trading Is Key To Success: But selection of right strikes and expiry makes all the difference. OpNodes does all calculations for you.
- For Option Buyers & Writers: OpNodes provide information on strikes and expiry for both options buyers and writers.
Selecting right strike for options trading is the trickiest part. We have solved this problem for options traders by analyzing the strikes that are weakest or strongest in terms of big-players activity.
OPTION BUYERS: Strikes and expiry recommended for options buyers for day trades. Preferably, for hedged positions. Weights can be changed by the trader according to outlook and/or other factors.
OPTION WRITERS: Strikes and expiry recommended for options writers for day trades. Positions must be hedged & adjusted as in accordance with price flow, taking help of outlook, extreme points, and/or other factors.
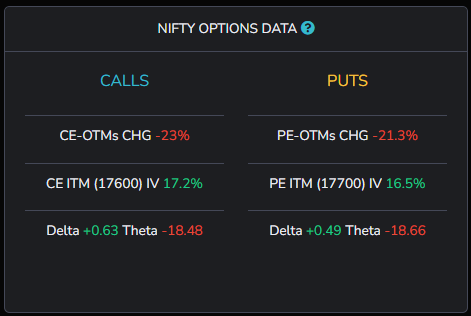
Options Data Analytics
- Data for Quant Options Trader: OpNodes use properietary methods to identify options with high activity for high relevancy
Precision in Data: Precision in critical data such greeks, CE / PE active options change and IV with above 95% confidence level
Options data is summarized view of latest happenings in the option chain. It is quite useful for quant traders.
CE-OTMs CHG: Percent change in the CE OTMs value. Nearest and highly active OTMs are used for this calculation.
CE ITM IV: Implied volatility (IV) of first CE ITM from current spot price.
CE ITM Greeks: Delta and Theta of first CE ITM from current spot price.
PE-OTMs CHG: Percent change in the PE OTMs value. Nearest and highly active OTMs are used for this calculation.
PE ITM IV: Implied volatility (IV) of first PE ITM from current spot price.
PE ITM Greeks: Delta and Theta of first PE ITM from current spot price.
NIFTY – Cyclic and Index Management Tracker
- Easy to Track Time and Price Movement: Track time and price movement of NIFTY top 10 stocks by weightage.
- Know When Stocks and NIFTY Are Rising or Falling: Track cyclic movement of stocks and NIFTY as they move from one quadrant to other
Index Management: Index management in NIFTY tracks the state as and when it changes from Active to Passive, from Strong to Weak, and vice-versa
- Peformanace and Trouble Zones: When NIFTY stocks enter performance or trouble zone, it brings along a good opportunity for pair trading. It helps minimize the risk
- State of Stocks and Index: Cyclic tracks visually presents the current state of NIFTY and its top 10 stocks in Live mode. Trader can capture the transitions of index from one quad to another
Free access to the cyclic tracker is available for limited clients only. Check access policy document for details.
NIFTY Cyclic Tracker keeps a watch on movement of its top-10 heavy weight stocks that account for more than 50% weightage. Over the last few years, there has been rise in index management instances i.e. managing the price levels of NIFTY with the help of these stocks. Index management, then, results into price moves in its F&O instruments. These stocks keep circling in 4 different phases at different times, thereby, keeping the levels of NIFTY stable. At times when these stocks clustering in single phase, it results in strong trend build up. Remember, cyclic tracker is not the buy/sell recommendation or advisory tool.
What are phases or quadrants (quad) of cycle?
Stock movements in any time range is cyclic in nature to larger extent. Such cyclic moves can be divided into 4 phases:
- Rising
- Strengthening
- Weakening/Falling
- Struggling
Common components of the tracker are:
- Size of the circle: Size of circle indicates the weight contribution of the stock in tracker (not in NIFTY50). NIFTY circle size does not indicate anything.
- Color of the circle: The color of stock circles change when it moves from one quadrant to another. It is as per the legend given at the top right of the tracker.
- “IM” or Index Management: Indicates to what extent the index management is currently in force. Passive IM means real strength or weaness in NIFTY. Whereas Active IM means that NIFTY price movement is being influenced because of some select stocks. The status of IM is followed by NIFTY spot price.
- Red zones at top and bottom tracker chart: Red zones are alarming zones indicating that any stock entering it, will be expected to exhibit extreme behavior.
Top zone is performance zone i.e. any stock entering it is expected to outperform other stocks in the tracker.
Bottom zone is trouble zone i.e. any stock entering this zone may exhibit unexpected weakness. - CF or Contribution Factor: This score indicates the contribution of particular quad to index management. This is checked when IM is active. Percent numbers can also be combined for horizontal quads (i.e. for top 2 quads and for bottom 2 quads, respectively) to compare strength vs weakness.
- Day Pos (
dropdown): When this option is selected, the tracker starts tracking smaller movements of the stocks. Preferably used by day trades and swing traders. - Long Pos (
dropdown): When Long Pos is selected as option, the tracker switch starts tracking bigger level changes that impact the stocks in longer time period. Preferably used by long term traders. - Horizontal and vertical axes: Horizontal axis is the longevity measure of the stock in particular quad (short to long) i.e. intent of the stock to stay within the quad. Vertical axis is the measure of behavior of stock movement (subtle to extreme). All references to be read from the center point of the tracker chart.
- Color of NIFTY element: The color of NIFTY element is intentionally given different color when it is in Rising or Falling/weakening quad. Since these 2 quads mark the beginning of possible trends, NIFTY color is different to identify it visually with ease.
Global Markets Impact on NIFTY and BANKNIFTY

- Live Global Markets: OpNodes track major markets with help of derived derivatives that are continuous and are live even when respective markets are closed
Impact Analysis: The impact (positive or negative or none) that the global market is expected to put on Indian markets
Systematic Option Chain
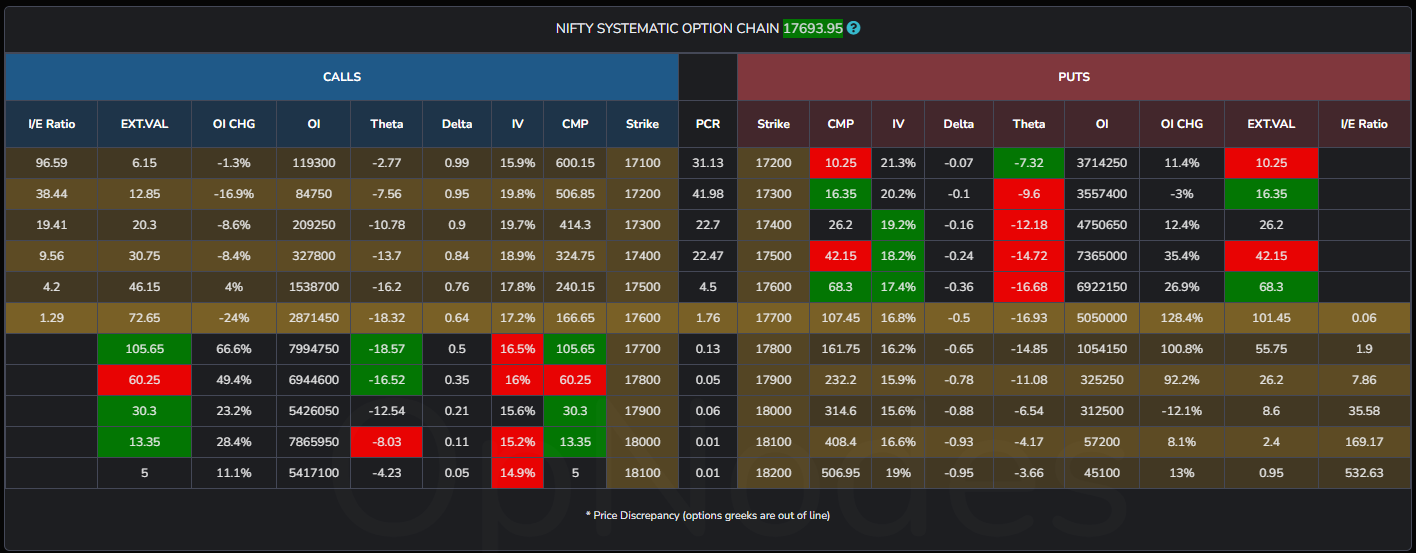
- Compare Right Strikes: Compare the strikes as per their positioning with reference to price – the right way of option chain analytics
Mission Critical Data: The data is calculated with the lowest error rate. Get information that is critical for making decisions in options tradging at single place and for multiple immediae strike pairs
Option chain modified to present information in most usable format, as preferred by the big players for quick decisioning (hedged trading).
Strikes placement: Unlike traditional Option Chains that do not present data in format useful for hedge traders, the systematic option chain presents strikes in comparable format. This is helpful for quick decisioning in hedged trading.
PCR: Put to call OI ratio of strikes in the row.
CMP: Current market price or last traded price of the Option.
IV: Implied volatility. Calculated using Black-sholes method.
Delta: Delta i.e. the speed of change in Option price with change in spot price of underlying asset when other greeks are stable.
Theta: The decay in time value of the Option that is likely to happen in 24 hours, provided there is not change in spot price of underlying asset.
OI: Open interest.
OI CHG: Change in open interest since previous trading session.
EXT.VAL: Extrinsive value, also known as Time Value of Option.
I/E Ratio: Moneyness ratio comparing interinsic value vs time value.
